When discussing the topic of FinTech, we often hear generalized statements like “Canadian FinTech is growing” or questions like “how can the Canadian FinTech ecosystem rank within the top five in the world?”
But FinTech is broad. It includes everything from algorithmic trading software to apps that help split the restaurant bill amongst friends. For those of us that follow the space, we intuitively know that innovation in online lending has been on a very different trajectory than cryptocurrency, but how different is hard to quantify. As a result, we tend to make generalized statements about FinTech which seldom lead to actionable insights. To push the conversation in the right direction, we need to be more specific. We need data.
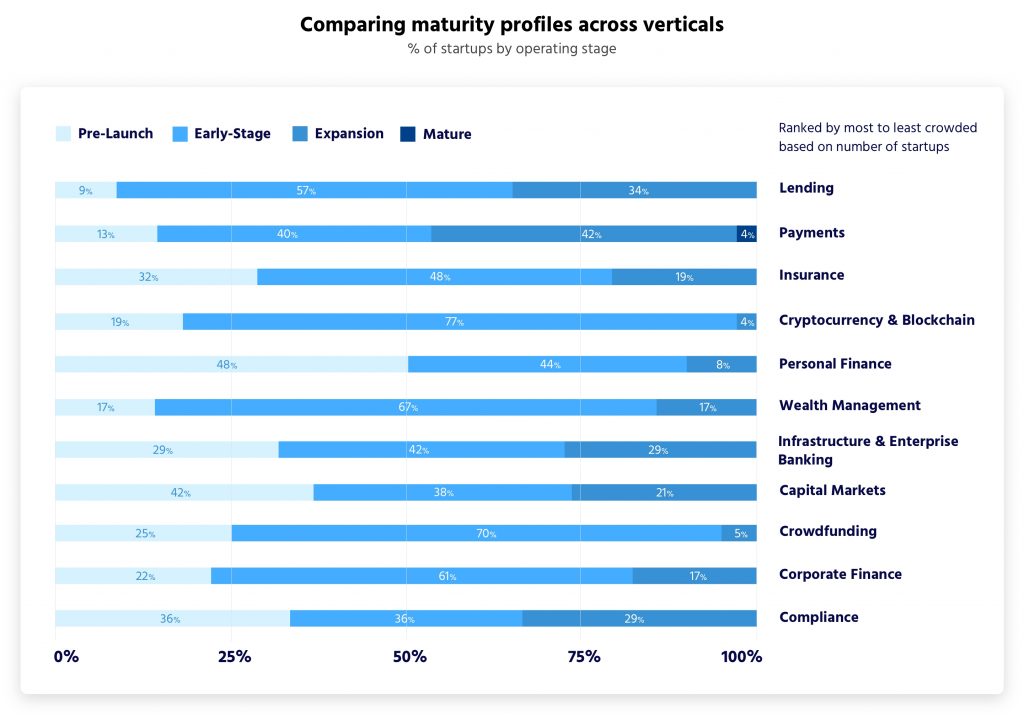
The insurance vertical is the third most crowded vertical in Canada.
At Ferst Capital Partners, we are constantly studying the Canadian FinTech landscape and we took it upon ourselves to dig deeper. More specifically, we tracked the growth of FinTechs offering their services in Canada to assess where the Canadian market offers opportunity for FinTechs or fosters innovation, and where it faces challenges.
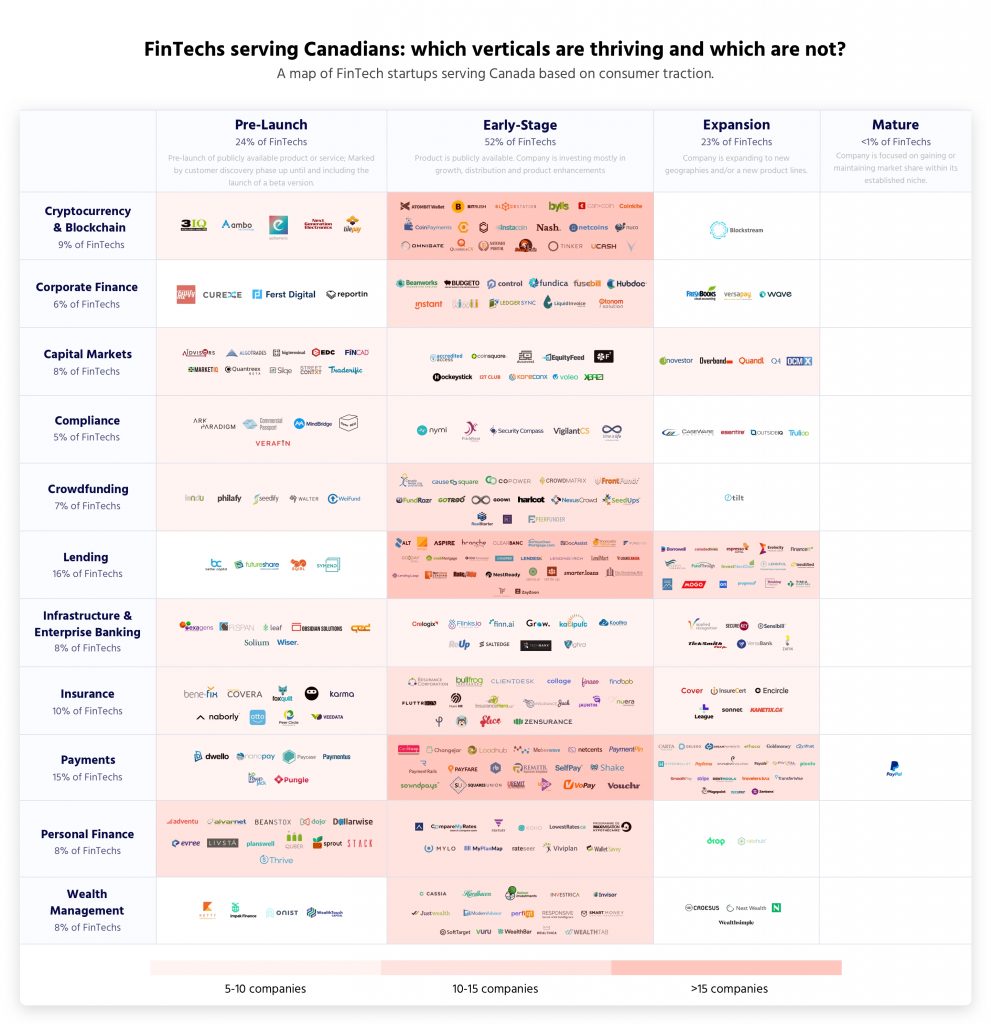
Our research, culminated in the heat map below, where we plotted the Canadian FinTech universe by each company’s operating stage: pre-launch, early-stage, expansion or maturity.
Although it would have been an easier exercise to plot these companies by capital raised instead of operating stage, we do not think that financing is a good indicator of success for FinTechs, particularly in Canada. We have seen ample startups raise lots of capital at very early stages (e.g. Wealthsimple, Grow, Blockstream) and others that have flourished while bootstrapped (e.g. Canada Drives, Ratehub). We thus find it far more interesting to track whether certain verticals are experiencing more consumer traction, as opposed to investor traction.
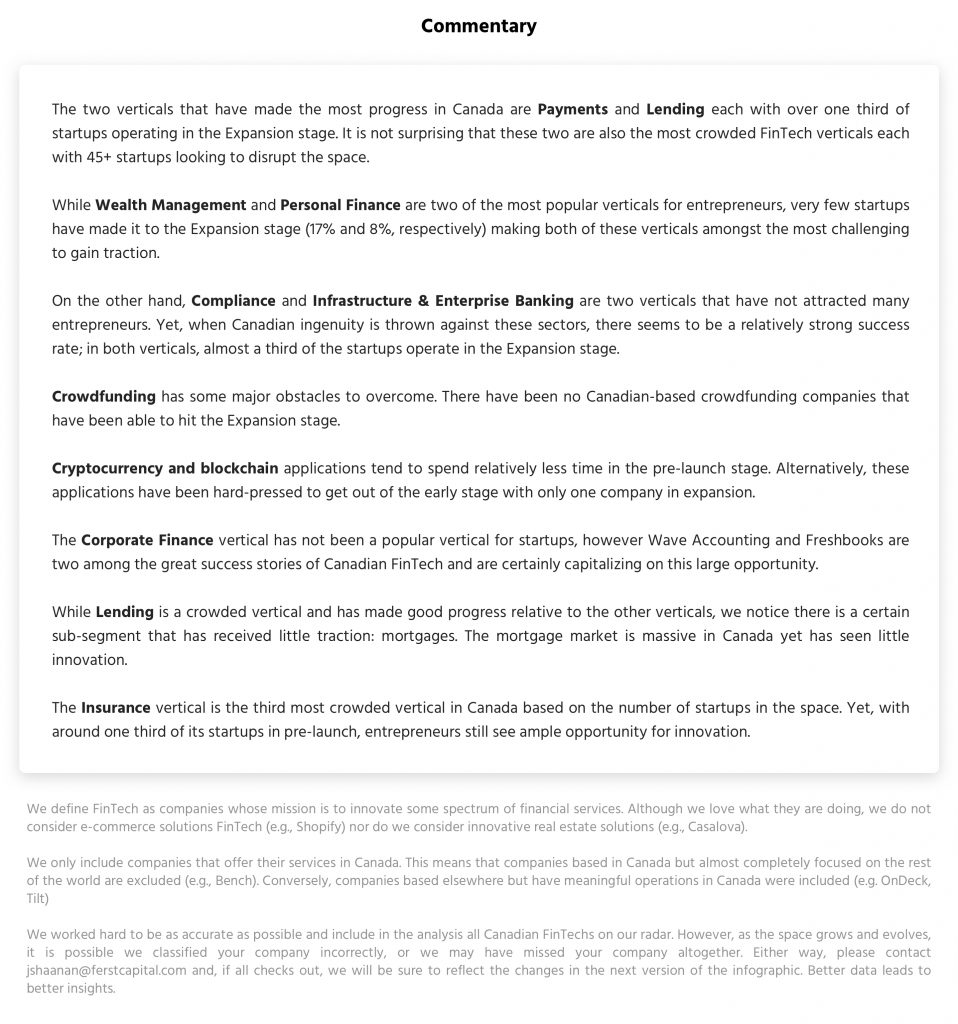
I am sure you will draw your own insights from the infographic (please share them with us!). In the meantime, here are a few of our own:
As we continue to update this map on a regular basis, we hope to find even more interesting metrics, such as identifying which stage each vertical experiences the highest abandonment rate. In the interim, these results should have implications for entrepreneurs looking to build a FinTech startup in Canada, investors looking for underserved verticals and regulators shaping policy to encourage innovation in Canadian financial services.
See the map below:


Note: We worked hard to be as accurate as possible and include in the analysis all FinTechs offering their services in Canada. However, as the space grows and evolves, it is possible we classified your company incorrectly, or we may have missed your company altogether. Either way, please contact jshaanan@ferstcapital.com and, if all checks out, we will be sure to reflect the changes in the next version of the infographic. Better data leads to better insights.
Special thanks to Sam Beushausen and the rest of the FCP Investment Team for putting this together.
Photo via PwC


