
After a decade on Wall Street and two more as a venture capitalist, Mike Kwatinetz, of Azure Capital Partners, has developed an approach to evaluating businesses that has helped him spot both promising startups and breakout companies. Rather than get bogged down in trying to understand hundreds of data points, he asks entrepreneurs to create a single spreadsheet showing little more than a handful of key performance indicators (KPIs). Critical to the exercise is going back two years on all those metrics, and projecting them one year into the future.
“Too often, founders want to show me 100-line spreadsheets, with line items for predicted monthly expenses plotted out for the next three years,” says Kwatinetz. “It’s not important to me what your phone bills will be in October of [next year]. You want to paint a picture that shows whether you’ve got a good business, even if it’s not profitable now.”
A spreadsheet to validate your basic business model
Something like the view below gives Kwatinetz a quick sense not only of where the company is, but also whether the business model is progressing toward the ultimate profitability goals — without wasting a lot of time trying to predict things that are neither consequential nor controllable enough to be worth the effort. Even if you could know for certain what employee dental benefits would cost in three years — which you can’t — it wouldn’t be a big enough number to matter. Including it would merely take time away from what you’re actually after: perspective.
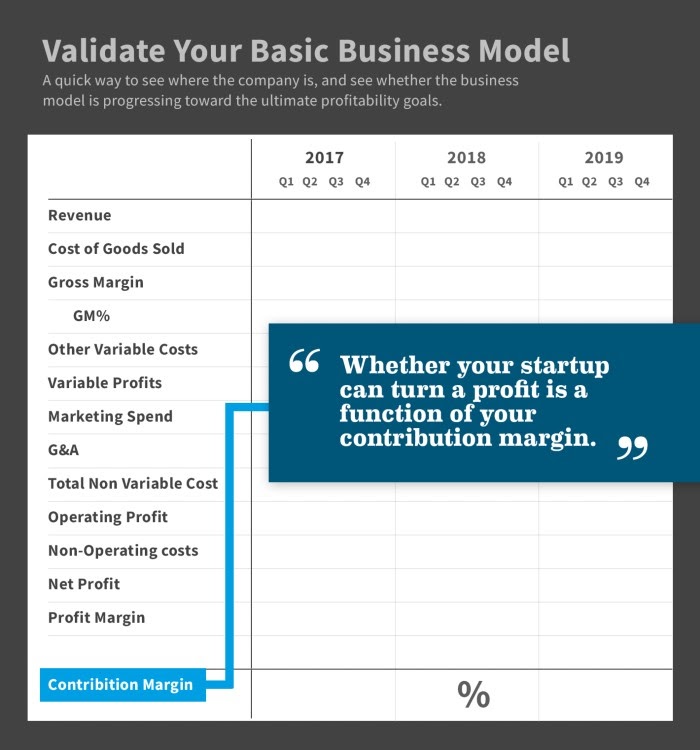
What exactly belongs in this spreadsheet may vary slightly depending on your business. A hardware company, for example, would need a line to reflect inventory management, whereas a company that sold entirely via self-service e-commerce would not have to reflect sales-related expenses. But in all cases, Kwatinetz insists on the following five figures: revenue, cost of goods sold, gross margins, marketing expenses, and operating profit.
“You want to paint a picture that shows whether you’ve got a good business, even if it’s not profitable now. ”
Cutting out the noise
This particular set of metrics works because seasoned experts can quickly spot the underlying patterns that matter. As an analyst in the 1990s, Kwatinetz honed this approach as he made early calls predicting the rise of Microsoft, Dell, and others. He used it as a VC to identify promising investments like VMware and Bill Me Later (acquired by eBay).
“It’s a helpful exercise because it shows you a storyline, and it always leads to a great discussion,” says Eric Grosse, co-founder and CFO of Chairish, a home decorating marketplace. “It reminds me of the famous Mark Twain quote: ‘I didn’t have time to write a short letter, so I wrote a long one instead.’”
Azure provided seed financing for Chairish, and invested in a subsequent round as well.
What’s your contribution margin?
One of the key insights — maybe the most key — that results from this analysis is understanding your underlying contribution margin, says Kwatinetz. “Everyone understands that most startups will lose money at the start, in the belief that when they scale they will become profitable. Well, whether that happens is a function of your contribution margin,” he says.
While definitions of contribution margin can vary, for the sake of this exercise, Kwatinetz simplifies it to gross margin dollars (revenue minus the cost of sales, such as parts and factory labour) minus sales and marketing costs.
“It’s not important to me what your phone bills will be in October of [next year]. You want to paint a picture that shows whether you’ve got a good business, even if it’s not profitable now.”
– Mike Kwatinetz, Azure Capital Partners
Since sales and marketing tends to vary with the number of products sold by a technology company, the contribution margin tells you the degree to which your products are helping you cover the fixed costs that are rigid facts of life — things like executive salaries, property taxes and general administrative costs for functions such as payroll and IT. If your contribution margin dollars never exceed these basic costs, your company will not have an operating profit.
Here’s an example: a fast-growing Series B startup has $10 million in gross margin profit, but spends $20 million on sales and marketing. That’s a negative contribution margin of 50 percent. That’s OK, because it’s not easy to win customers for the first time—and because hopefully those customers will buy from the startup for many years without nearly as much marketing and sales investment.
Now let’s say it’s three years later, and gross margins have doubled to $40 million while sales and marketing have grown to just $30 million. That’s a contribution margin of 25 percent, enough to help cover those other costs. If gross margin grows to $40 million but so does the cost of sales and marketing, the company’s sales are still not “contributing” to reaching operating profitability. Just ask Webvan, the first-generation grocery delivery startup that closed in 2001 after raising $800 million in venture financing.
Part of the company’s problem was that sales never came close to covering the cost of its distribution centers and a fleet of delivery vehicles (more recent players in grocery delivery, such as Instacart, use grocer’s distribution centers, and hire contractors with their own cars to make deliveries).
There’s no single right contribution margin for every company. Labour-intensive companies with high fixed costs will tend to have lower contribution margins, as will companies who sell a low-margin product. Even some high-growth firms such as Lyft have negative contribution margins, says Kwatinetz (he thinks Uber’s is slightly positive, at around 5 percent). But a healthy SaaS company should have a contribution margin of 25 percent or more.
“I’m not saying there aren’t VCs who will make a lot of money while ignoring contribution margin, but not enough companies or their investors pay enough attention to it,” says Kwatinetz.
Historical data is the best antidote against magical thinking
Kwatinetz’s quick-look exercise differs from the norm in a few other ways, as well. For starters, most entrepreneurs focus on how these key metrics are trending in the future. Kwatinetz insists on at least two years of historical data. For starters, it’s the only way to factor in seasonality, which is especially important for any consumer-focused company, particularly ecommerce plays.
Perhaps more important, showing actual historical data will quickly expose any “magical thinking” by management. “I call it the ‘and then the miracle happens’ phenomenon, where lines start moving up and to the right based on some unproven assumption about what the future holds,” he says.
He also wants only quarterly rather than monthly data for these metrics. Not only does this smooth out lumpiness that can obscure the long-term trends, it also makes it possible to display three full years of data legibly on a single slide.
Using smart KPIs to scale
Of course, having an effective summary view is no substitute for knowing the details about how your business is performing. The best CEOs have an implicit understanding of both, and of how they interrelate, says Kwatinetz. He recalls a trip to Sioux Falls, Iowa during his Wall Street days to advise Gateway 2000 founder Ted Waitt in the early 1990s. “I remember walking through this muddy cow pasture to get to his office, as he calculated the impact of reducing square footage of office space per employee on margins,” says Kwatinetz.
After bringing PCs into millions of homes, Gateway was acquired in 2007 by Acer for more than $700 million. That’s not bad for a company that Waitt started with a $10,000 investment from his grandmother. For that kind of success, you have to be able to see the forest and the trees.
For a more detailed look at Kwatinetz’ methodology, see posts on his Soundbytes II blog called Interesting KPIs for a Subscription Company and Why Contribution Margin is a Strong Predictor of Success for Companies.
Would you like to see how these ideas play out in practice? Download a working version of the KPI spreadsheet.
For nearly 40 years, Silicon Valley Bank has helped many leading innovators get their start.
Learn more about how SVB can help your business reach the next stage.
Syndicated with permission from Silicon Valley Bank.